
The yield curve inversion — specifically the spread between 10‑year and 2‑year Treasury yields — has become a critical stress signal for banks holding fixed‑rate asset portfolios. While much attention is given to the sign of the spread (negative = inversion), the magnitude of a bank’s duration mismatch determines whether that inversion becomes a solvency event or a manageable drag on net interest income.
But what happens when a bank’s liability duration(or net duration gap) is deeply negative — say, -1.4 years — versus a more balanced -0.25 years? The answer lies in how falling long‑term yields (or rising short‑term yields) interact with your fixed‑rate assets.
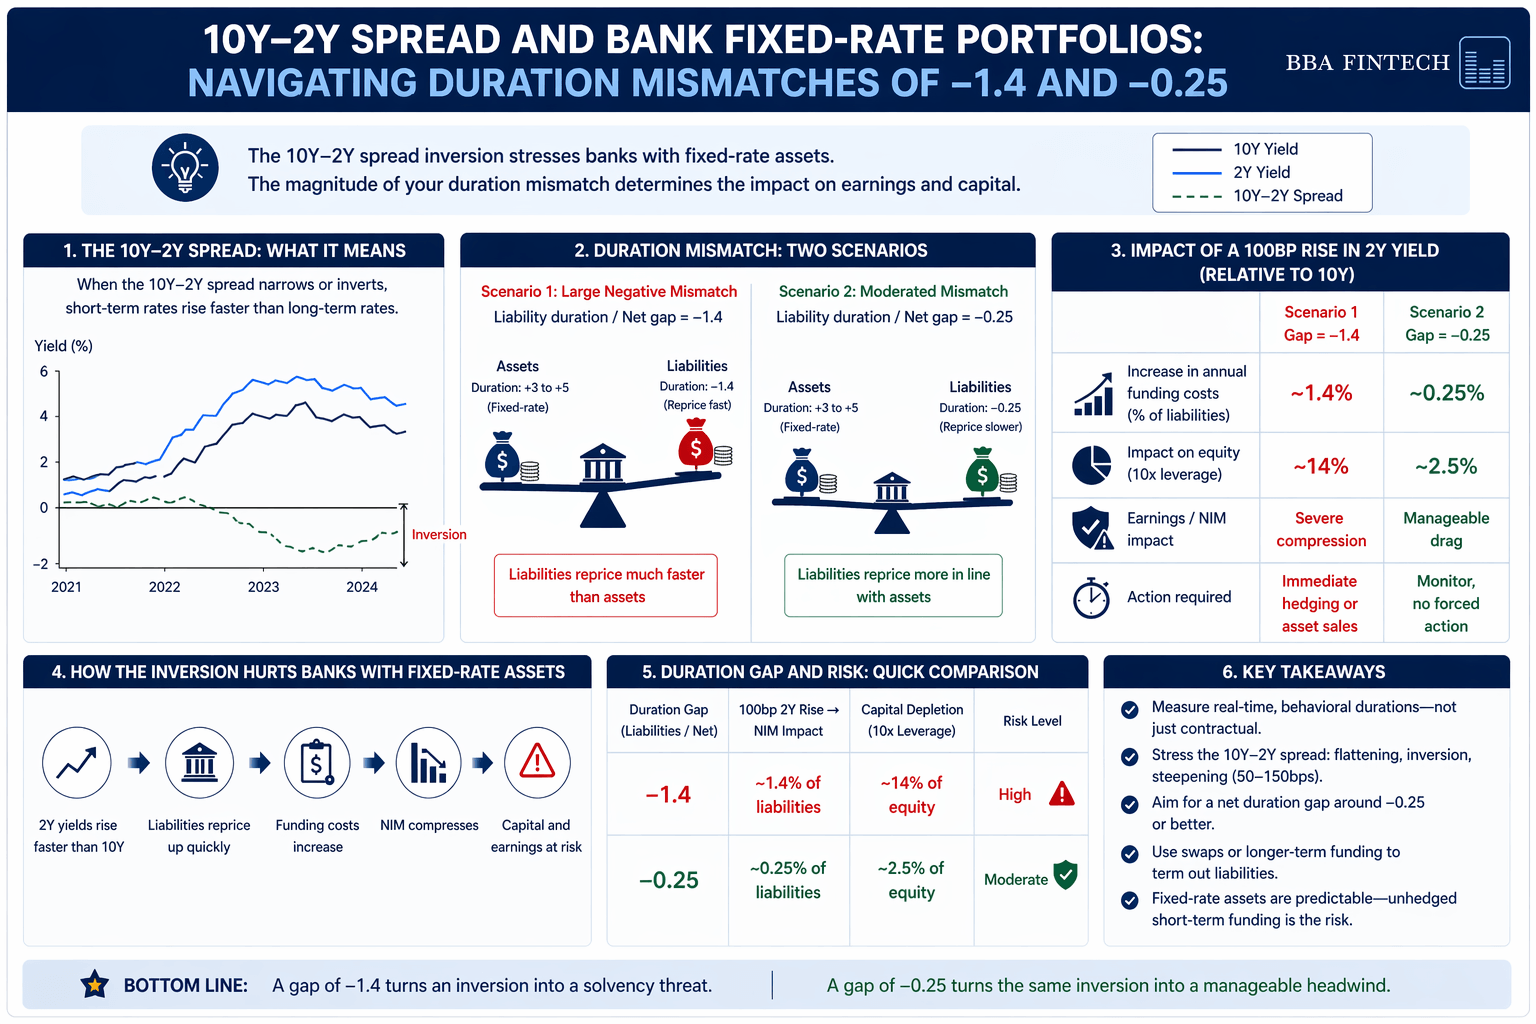
Scenario 1: Large Negative Mismatch (–1.4)
A liability duration of -1.4 years (or a net gap of -1.4) means the bank’s funding side is extremely short‑dated or rate‑sensitive compared to its fixed‑rate assets.
When the 10Y-2Y spread narrows or inverts:
- Short‑term rates rise(2Y yield increases) faster than long‑term rates (10Y yield).
- Liabilities reprice upward quickly— deposit costs or short‑term borrowings become expensive.
- Fixed‑rate assets(duration positive, say +3 to +5 years) generate the same contractual income but now face:
The -1.4 effect: Every 100 basis point widening of the 2Y yield (relative to 10Y) increases annual funding costs by ~1.4% of the liability base, with no offset from asset repricing. If the bank is leveraged 10:1, a 100bp shock can wipe out 14% of equity. This is why deeply negative gaps are called “the silent killer” during inversion cycles.
Real‑world example (2023):Several regional US banks had estimated liability durations near -1.5. When the 10Y-2Y spread inverted to -100bps, their cost of deposits rose 150bps in 12 months, while their 5‑year fixed mortgage book yielded unchanged. The result: negative carry and forced asset sales.
Scenario 2: Moderated Mismatch (–0.25)
A liability duration of -0.25 years (or net gap of -0.25) indicates a bank that has actively matched the repricing characteristics of its fixed‑rate assets with longer‑dated or stable liabilities.
When the 10Y-2Y spread inverts:
- Short‑rate rises still hurt, but the impact isone‑fifth the magnitudeof the -1.4 scenario.
- The bank may have term deposits, retail savings with lagged repricing, or swapped its floating liabilities to fixed.
- Fixed‑rate assets still lose market value, but theearnings shock is contained.
The -0.25 effect: A 100bp spike in short rates increases annual funding costs by only 0.25% of liabilities. Assuming a 10% equity ratio, the drag on ROE is ~2.5% — uncomfortable but not catastrophic. More importantly, the bank has time: it can let assets mature or restructure before the cumulative gap erodes capital.
Why -0.25 is the resilience benchmark: Shifting from a net repricing GAP of -1.58 years to -0.25 years fundamentally changes resilience without changing assets— by terming out liabilities or adding receive‑fixed swaps. That is the difference between a bank that survives an inversion and one that becomes a headline.
The 10Y-2Y Spread as a Risk Metric, Not a Forecast
Many treat the 10Y-2Y spread as a recession predictor. For fixed‑rate bank portfolios, it is better understood as a liquidity and capital allocation stress test:
Practical Takeaways for Treasury and Risk Teams
- Measure your real‑time gap– Not just contractual repricing, but behavioral durations (e.g., demand deposits that act like 3‑month money in a rising rate environment).
- Stress the 10Y-2Y spread directly– Run scenarios where the curve flattens, inverts, or steepens by 50–150bps. Look at earnings at risk (EaR) and economic value of equity (EVE).
- The -0.25 target is achievable– Use interest rate swaps (pay fixed, receive floating) or issue longer‑term debt to push liability duration closer to zero or positive. You don’t need to eliminate mismatch; you need to make it survivable.
- Fixed‑rate assets are not the enemy– They are predictable revenue streams. The enemy is unhedged short‑term funding against those assets.
Final Word: Do You Want to Be Future‑Proofed?
If your bank's liability duration (or net gap) is closer to -1.4 than -0.25, the 10Y-2Y spread is not an academic curiosity — it is a weekly boardroom metric. Every basis point of inversion widens a hidden short‑put option on your equity. Conversely, moving toward -0.25 transforms the same spread into a manageable headwind.
As one CFO put it after the 2023 mini‑crisis: "We thought we were duration‑neutral. Then we realised our liabilities had a mind of their own." Don't let that be your post‑mortem.
Call to Action: Let's Future‑Proof Your Bank
You've seen the numbers. You understand the risk. Now it's time to act.
If your bank's liability duration or net repricing GAP is closer to -1.4 than -0.25, you cannot afford to wait for the next yield curve shock.
We help banks:
- Measure your duration gap (including behavioral liabilities)
- Independently validate your ALM model
- Stress the 10Y-2Y spread and other curve scenarios
- Remodel your liability structure to move toward -0.25 or better — without selling a single fixed‑rate asset
- Implement cost‑effective hedges (swaps, options, or term funding)
So here's the question we leave with you: Do you want us to help future‑proof your bank — before the next curve move forces your hand?
If the answer is yes, let's talk. We've done it for others. We can do it for you.
Your next move:
Or simply reply to this article and let us know:
- Your current estimated duration gap (if known)
- Your biggest concern about the current yield curve
We'll respond within 24 hours with a high‑level opportunity assessment — no obligation, just a conversation.
Don't let your liabilities have a mind of their own. Let's build your sustainable future — starting today.